VNA Saver – PC Software
There is now a variety of PC based software that is available to use with your nanoVNA. In this post, I will be demonstrating NanoVNASaver(version 0.0.9). This is developed by Rune Broberg and is fully open source. Rune originally developed the software as a way to save Touchstone files from the NanoVNA to use in other programs, but couldn’t resist expanding it’s functionality into what is now a fairly complete PC app to run the NanoVNA. If you want to participate in conversations with Rune, He is active on the groups.io nanoVNA group which is an excellent place to find all the latest tips and experimental firmware builds etc. https://groups.io/g/nanovna-users
The software is written is compatible with Windows, Linux and Mac, but I will only show Windows in this guide.
Step 1 – Download and run software(Windows users)
Follow this link to download the latest release of NanoVNA Saver.

For Windows you can download the pre-compiled .exe file
Once downloaded you can copy the executable to a suitable location on your computer. In m case I just dropped it onto the desktop. When you first run the application Windows will ask if you trust it. CLick the ‘Run anyway’ option and your away. Dead easy!!
Step 2 – Connect to your NanoVNA
If your NanoVNA was connected to your computer via USB before opening the software, the serial port control, may already be populated with the correct serial port number. If not, or if you have multiple serial ports you may need to find the com port number manually. You can fire up Device Manager to see a list of installed com ports.

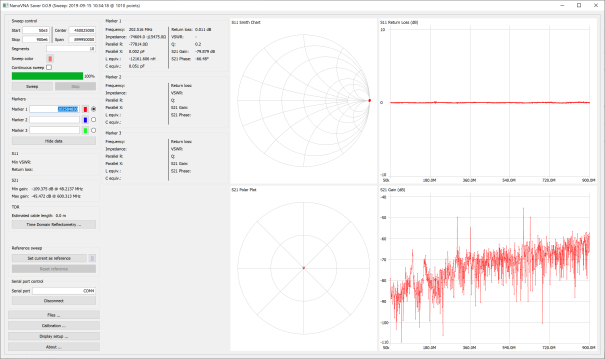
NanoVNA Saver. Enter the correct com port name into this box. In my case ‘COM4’
In my case the NanoVNA connected as ‘COM4’. Enter this in the serial port box and click ‘Connect to NanoVNA’. Other than the connect button being relabelled ‘Disconnect’ not a lot will happen yet.
Step 3 – Setup your sweep
Most of this is fairly self explanatory. The frequency units are Hz, which is a bit of a pain when typing large numbers.

Sweep Control
My top tip here is to use scientific E-notation.
So for 50KHz you can type 50e3, for 300MHz you can type 300e6. All you need to know is ‘e3’ multiplies you number by 1000 and ‘e6’ multiplies by 1,000,000.

Left = 1 segment, Right = 10 segments.
Setting ‘Segments’ to greater than 1 will divide your sweep into a number of smaller 101 sample blocks. This will be at the expense of sweep time, but gets around one of the biggest drawbacks of the standard NanoVNA.
Now click ‘Sweep’ to run the VNA once. Alternatively, check the ‘Continuous sweep’ box to set automatically repeat the sweep.
Step 4 – Calibration
First disable ‘Continuous sweep’ and click the ‘Calibration’ button on the lower left of the GUI. This will bring up the calibration window. It’s worth noting that the calibration here is separate to the internal calibration of the NanoVNA so calibrations in this software will not have an effect on the nanoVNA display.
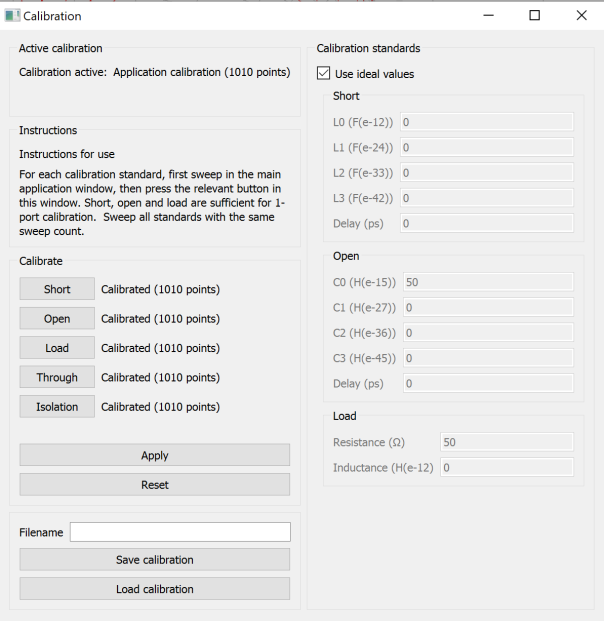
The basic calibration routine is similar to that outlined in part 1 of this blog series. The only difference is that you need to click sweep on the mainscreen before pressing each Open, Short, Load, Through and Isolation buttons.

Calibration Window
Once all standards have been used, click apply to activate this calibration. You can also click save to store the cal for later use.
It is possible to use non-ideal standards here, so if you do happen to have an expensive cal kit that is provided with all this data, then fill your boots and add this in to get more accurate results. In theory, I could have changed my Load from 50Ω to 51Ω to compensate for my cheap load standard, but I am lazy and when measuring many things it’s not really important.

My calibration. With Load connected to port 1.
Changing your display.
For my next blog post, I want to measure one of my Ultra-Wideband Spiral Antennas. For this, I am only interested in S11 measurements for the time being, but it would be nice to show SWR also.
Click ‘Display Setup …’

Display setup
I will choose VSWR for the lower left plot.

HexAndFlex 300MHZ+ Circularly Polarised Spiral Antenna.
Now lets have a quick look at how this compares to a professional grade VNA. I initially tried using the NanoVNA saver to import a Touchstone S2P file from a proffesional grade VNA, but i didn’t trust the results, so I used QUCSstudio to import them both.

Using QUCS studio to compare touchstone files
Top Tip – QUCS studio can read your touchstone files and make them part of an electronic simulation. It can also automatically calculate a matching network for any given frequency.

QUCStudio comparison
This was a quick test and I really didn’t take too much care to isolate the cable from the antenna. At lower frequencies(below the 300MHz design frequency) the cable is not as well isolated from the antenna. To make better measurements of this I would want to add a balun, or some ferrites to the cable to help isolate the DUT(Device Under Test) from the cable.
Conclusion
VNASaver is a great tool. Much better than the basic software that was originally available for the NanoVNA. The author, Rune is regularly updating it with new features and UI improvements. I will need to do further work to fully explore its features, but for now I can highly recommend it.
Barry,KU3X
I wonder if your software could be extended to provide the option of a log(magnitude) vs. log(frequency) scaling? A further improvement would be the ability to set the scan frequencies at a constant number of points per decade, so that the curves be evenly populated. Can that be achieved with the NanoVNA?